Time-series data is an important part of many businesses and industries. It can be challenging to manage, store, and explore. With the start of big data, standard spreadsheet software can no longer handle time-series data effectively. To handle these obstacles, you need the right tools. Time series tools can help you effectively manage and analyze large amounts of data.
Time series data and analysis are crucial for exploring trends, detecting patterns, forecasting insights and optimizing key metrics across businesses. As data volumes surge into petabytes and analytics gain importance for progress, establishing the right time series tools provides a foundation for discoveries fueling innovation and competitive advantage.
Read On: [2023] 6 Best Manufacturing Scheduling Software: Streamline Your Operations With Smart Manufacturing
Table of Contents
What are Time-series tools?
Time-series tools are specialized software designed to manage and analyze time-series data. Time series tools enable working with time-stamped data collected over continuous intervals. They enable visualizing information as lines or plots, identifying seasonal effects and cyclical patterns, smoothing anomalies, discovering leads/lags in relationships, building predictive models and exploring “what if” scenarios through simulations.
Why Do You Need Time Series Tools?
Time-series data can be complex and challenging, especially with large datasets. Using time-series tools will make your data analysis process more efficient and accurate. These tools will help you to:
- Gain valuable insights: Time series tools ease identifying trends, patterns, seasonal effects and cyclical fluctuations in metrics that drive key business outcomes. Analyzing data over time reveals insights for optimizing resources, streamlining processes and personalizing experiences.
- Forecast future trends: Many time series tools provide forecasting functionality enabling predictions of how metrics, KPIs and other important data points may change over time. Forecasts can help prepare for impacts on strategy, budgeting, capacity planning and resource allocation.
- Optimize resource utilization: Observing metrics and events over continuous time intervals makes it possible to spot waste, inefficiencies and periods of under/over utilization in resources like infrastructure, budget, staff, etc. So that you can rightsize and minimize costs and achieve goals.
- Enable predictive analytics: Time series data and techniques form the basis for many predictive models and algorithms. By understanding historical marks, relationships and seasonal effects, time series tools ease expecting possible issues, customer needs, optimal business decisions and other predictive insights for achieving a competitive advantage.
- Monitor key metrics in real-time: Time series tools provide the capability for continuously following important metrics, KPIs, events, alerts and other parameters that influence business performance, quality, observation and risk. Real-time monitoring makes it possible to answer issues immediately, maintain metrics on the path and ensure goals are met.
- Enable data-driven innovation: Exploring time series data with the right tools leads to discoveries that inspire new ideas, strategies, products, services and solutions. Instead of making decisions based on assumptions or gut feelings, time series analysis provides insights for innovating that increase outcomes and minimizes waste or failed initiatives.
- Achieve a competitive advantage: By optimizing key metrics, expecting market changes, personalizing experiences and simplifying operations, time series tools help organizations achieve higher growth, productivity, quality, efficiency and customer satisfaction relative to competitors. The competitive benefit depends on insights and progress, which time series analysis boosts.
- Adapt to changing data volumes: As more and more data is collected over time, time series tools provide scalable options for storage, management, queries, visualization and collaboration across large datasets. They enable achieving value from petabytes of information in addition to smaller datasets, opening opportunities for breakthroughs and sustainable progress.
Top 16 Time Series Tools
TrendMiner

TrendMiner is a self-service industrial analytics software. Discovering rhythms driving important business metrics and events helps users easily visualize, monitor and analyze time-series data from production processes, allowing them to quickly identify and solve production issues. It Reveals seasonal effects, cyclical fluctuations, and timing of influences shaping metrics over time.
Seeq
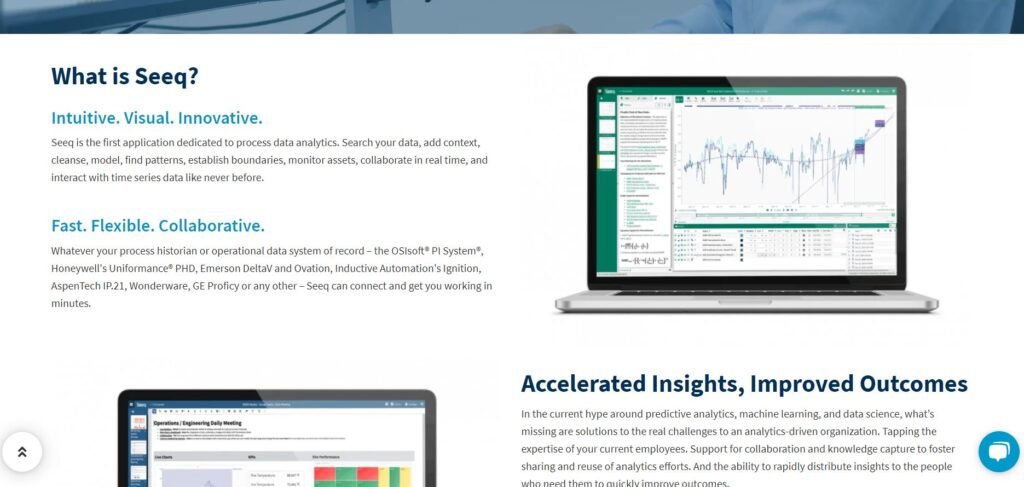
Seeq is an advanced analytics software that enables users to find hidden insights and trends in time series process manufacturing data, resulting in more efficient and profitable operations. Brings people and insights together around data through an intuitive interface. Enables asking complex questions simply and getting clear, compelling answers instantly. An intuitive analytics platform that makes data more accessible and useful than ever.
InfluxDB
InfluxDB is an open-source time-series database that stores and queries large datasets in real-time. It is optimized for high write and query performance and is commonly used for monitoring, analytics and IoT applications. Facilitates analyzing information at granular resolutions while handling vast volumes. Financial grade time-series database optimized for high-performance analytics and real-time insights.
Tableau
Tableau is a popular business intelligence and data visualization software that Unlocks insight and impact through an open and flexible platform for self-service data visualization and analysis. Enables discovering insights intuitively through an easy-to-use drag-and-drop interface. Easily connect to and analyze various data sources, providing valuable insights and allowing them to make informed decisions.
Minitab
Minitab offers various statistical tests and tools, allowing users to improve processes and products. Simplifies statistics with an intuitive interface focusing on analysis and communication. Incorporates tools for process management, hypothesis testing, experimental design, predictive modelling, machine learning and more. Promotes understanding insights and enables action through visual and narrative storytelling.
Kinetica
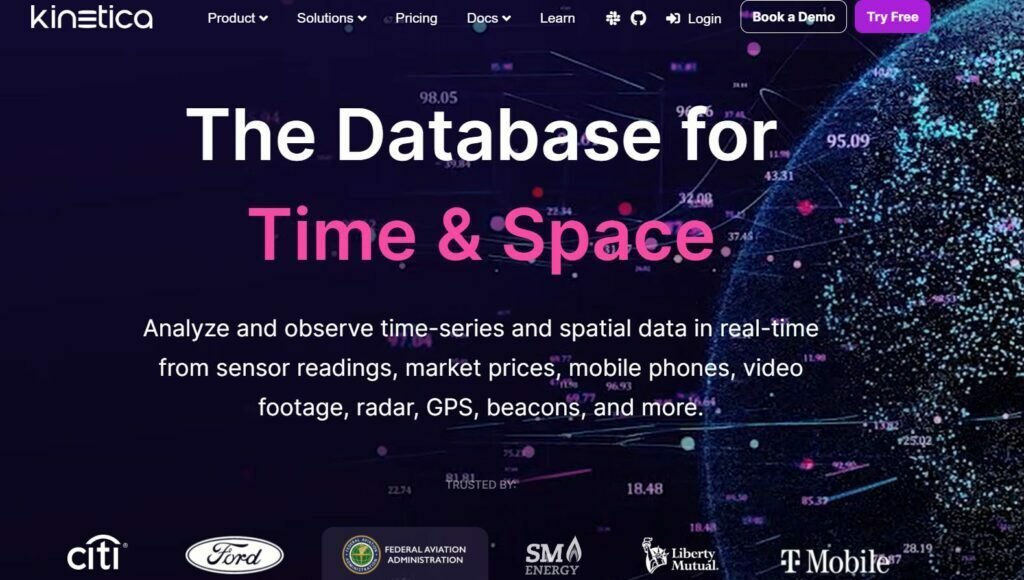
Kinetica is a GPU-accelerated database that Processes and analyzes fast data in motion at a massive scale with integrated streaming processing and analytics. Handles fluctuating workloads dynamically while keeping latency low through a Kinetica warehouse engineered for real-time insights and interactive exploration. It is commonly used for real-time analytics, machine learning, and geospatial applications.
Microsoft Azure
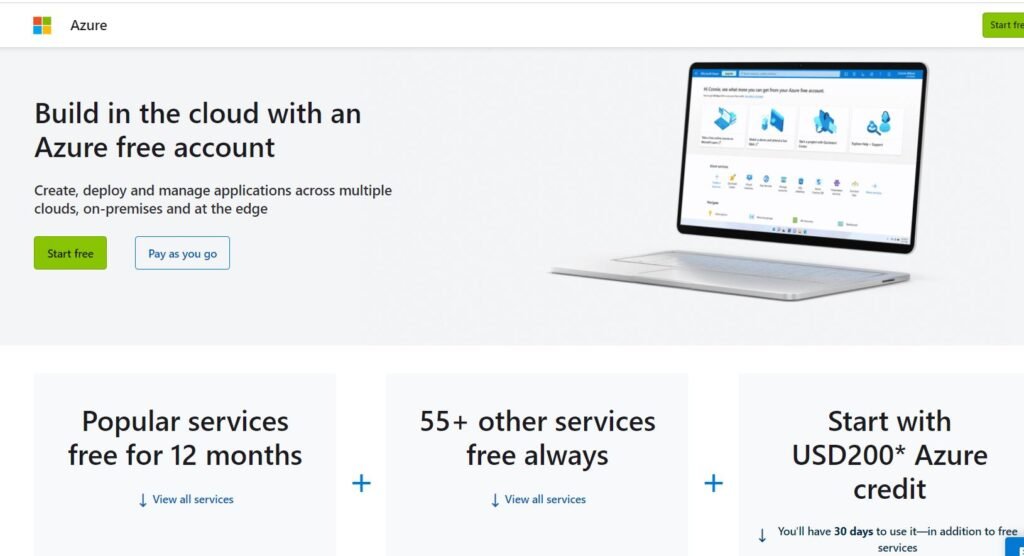
Microsoft Azure offers various services, including virtual machines, storage, databases, and analytics. It Provides a flexible cloud platform with seamless integration and management of resources. Offers tools and services including computing, networking, storage, database, API management, analytics, machine learning and more to accelerate building and managing applications. Integrate everything; innovate faster.
Anodot
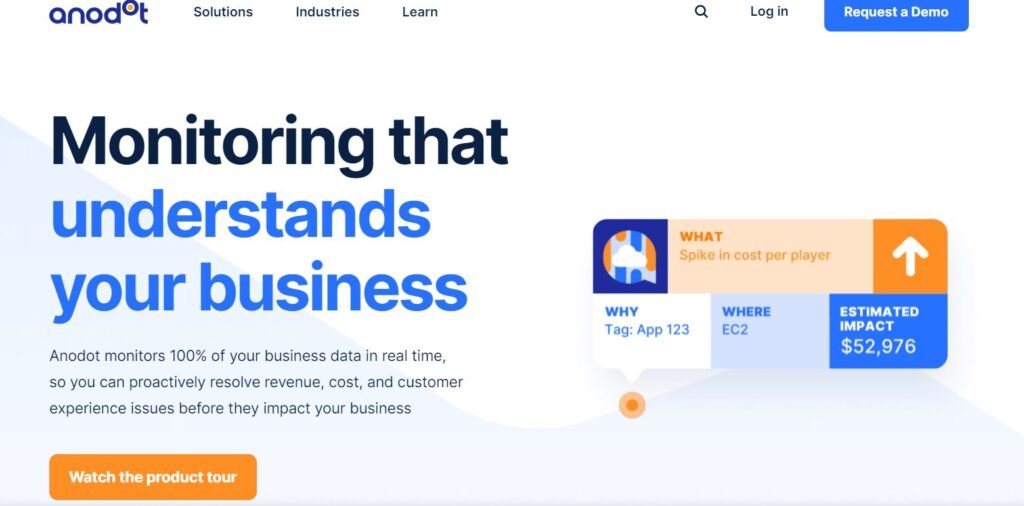
Anodot is an AI-powered autonomous analytics platform that provides real-time insights, Alerts stakeholders to unexpected changes in key metrics that impact business health, growth and risk. Applies anomaly detection at scale to identify subtle signals within the noise that often preface issues cascading without notice. Enable Early warnings that help in proactive mitigation and continuous optimization.
Shapelets
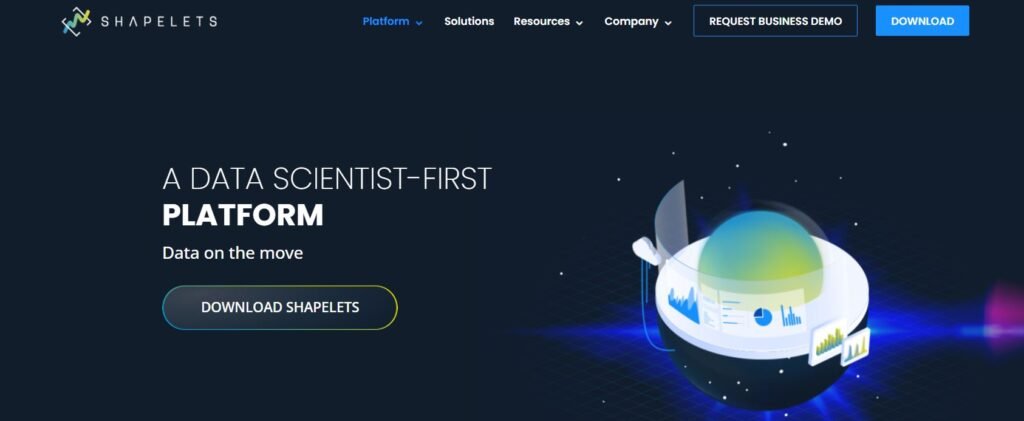
Shapelets is a time-series pattern recognition and forecasting software that Discovers small units of time series data that precisely categorizes patterns. Identifies the atomic building blocks beneath trends to unlock more nuanced insights. Each shapelet is a glimpse into rhythms shaping your data. It is commonly used in financial and medical applications, among others.
Axibase
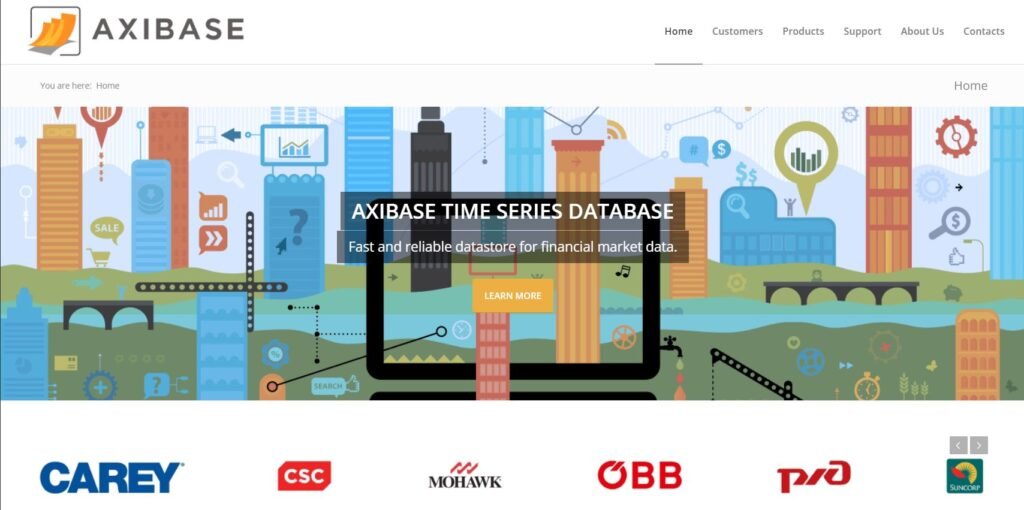
Axibase is an open-source time-series database that precisely stores metrics, events and attributes as time-series data. Massive volume handling and lightning-fast queries enable insights at intraday granularity. Financial grade time series database used for high-performance analytics. It is commonly used in IoT and other real-time applications.
Trendalyze

Trendalyze is a pattern recognition and anomaly detection software that Unearths hidden cycles and insights through visual pattern recognition. It can Scan endless time series for surprising seasonal effects, long-term trends, key milestones and leading indicators influencing important business metrics.
Warp 10
Warp 10 is an open-source platform for storing, analyzing, and visualizing time series that analyzes millions of metrics per second. Handles unpredictable load spikes and constant change by scaling elastically across cluster nodes. It has a High-performance time series database optimized for real-time analytics and stream processing workloads.
Circonus
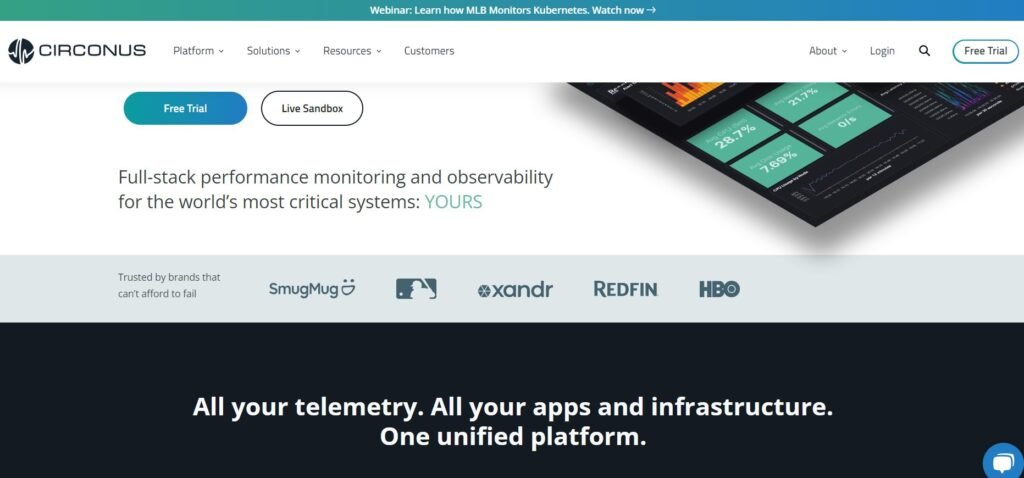
Circonus is a monitoring and analytics platform for IT infrastructure and applications that Provides full-spectrum visibility into key metrics that determine business health, growth and risk. It is helpful in Real-time monitoring and alerting, historical analytics, reporting and data visualization on a single platform. All the tools needed for proactive management and continuous optimization.
Baresquare
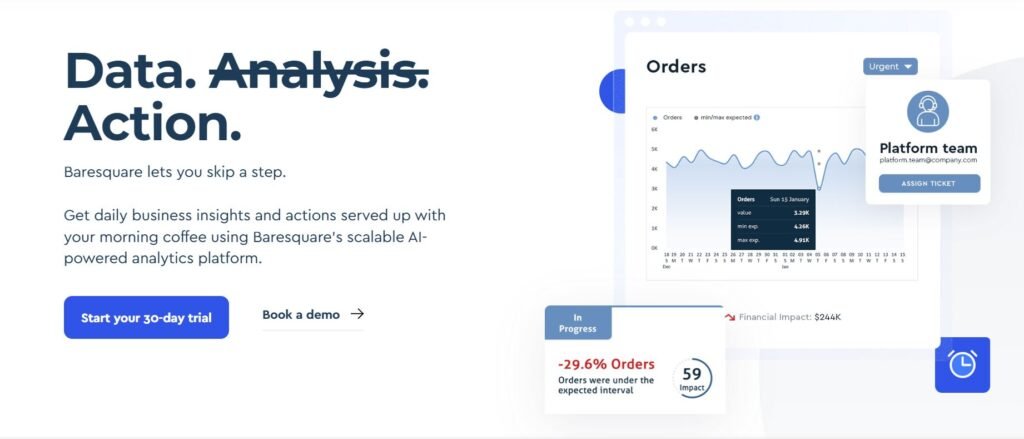
Baresquare is an open-source tool for monitoring and alerting time-series data. It applies machine learning to understand space usage deeply so you can optimize it. It records activity patterns at room and workspace granularity over time to gain insights for improving productivity, collaboration and real estate portfolio management.
Dygraph
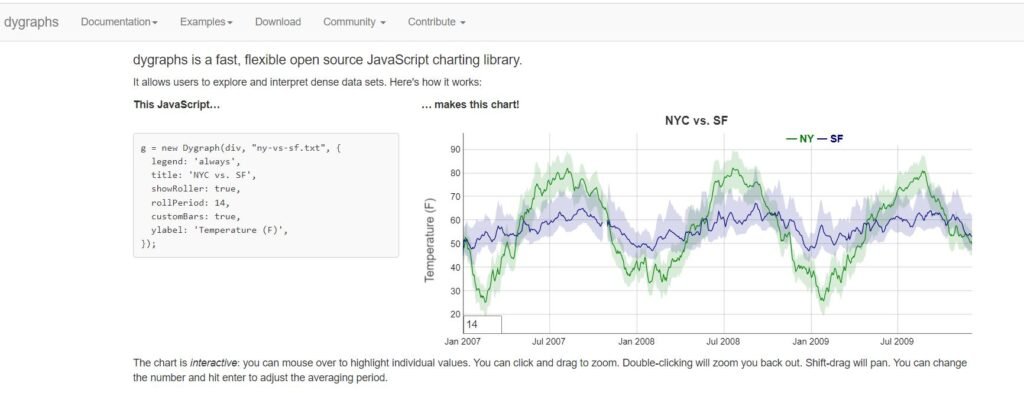
Dygraph is a JavaScript library for visualizing and exploring time-series data that instantly renders interactive time-series charts from huge datasets. It has a feature of Zoom in on key metrics at any resolution while filtering by attributes, applying mathematical expressions or custom formatting. Collaborate around synchronized views of the same chart for more nuanced analysis and discussion.
Prophet
Prophet is an open-source tool for time-series forecasting based on an additive model. It automatically picks model components to simplify parameter tuning while effectively handling events, trends, cycles and other anomalies. With this, you can Make insightful predictions and what-if analyses more accessible.
In conclusion, various time series tools are available for businesses and individuals to manage, analyze, and forecast their time series data. With time series tools, you see the rhythm and beat of underlying numbers. You find subtle signals indicating issues or opportunities before they manifest as larger problems or possibilities.
You make predictions by understanding past and present influences on the future. Time series tools facilitate analyzing data points arranged in chronological order over time. Businesses can make informed decisions based on their time series data.
FAQs
What is time series data?
Time series data is a type of data that is recorded over time at regular intervals. It is commonly used in finance, economics, and weather forecasting.
What industries use time-series analysis?
Time-series analysis is used in various industries, including finance, manufacturing, healthcare, and more.
What are some popular time-series analysis tools?
Some popular time-series analysis tools include TrendMiner, Seeq, Axibase, Tableau, and Prophet.


